See what your agents are actually doing
Production agents are black boxes. AgentLens shows you every conversation, every decision, every tool call—so you can fix problems before users complain.
- Browse real conversations and understand how users interact with your agents
- Trace multi-agent orchestration with millisecond precision timing
- Track tokens, costs, and performance across your entire agent fleet
Complete visibility across your agent fleet
Stop flying blind in production
You built the agent. You tested it. But once it's live, you have no idea what's actually happening. AgentLens gives you complete visibility—from fleet-wide metrics down to individual tool calls.
See every conversation
Browse real user interactions as they happen. Filter by agent, time, tokens, or errors. Click into any conversation to see exactly what was said.
Understand multi-agent flows
When agents call other agents, see the full orchestration. Which sub-agent handled what? Where did time go? What failed?
Track what matters
Tokens, latency, tool calls, error rates—all in one dashboard. Spot anomalies before they become incidents.
Debug in minutes, not hours
Click a failing conversation, see the trace, find the problem. No grep through logs. No guessing. Just answers.
Business leaders and builders ask different questions
AgentLens answers both. Conversations view for understanding users. Traces view for debugging systems.
For Business Leaders: Understand how users interact with your agents
Browse every conversation across your agent fleet. See what users are asking, how agents respond, and whether goals are being achieved. No engineering degree required.
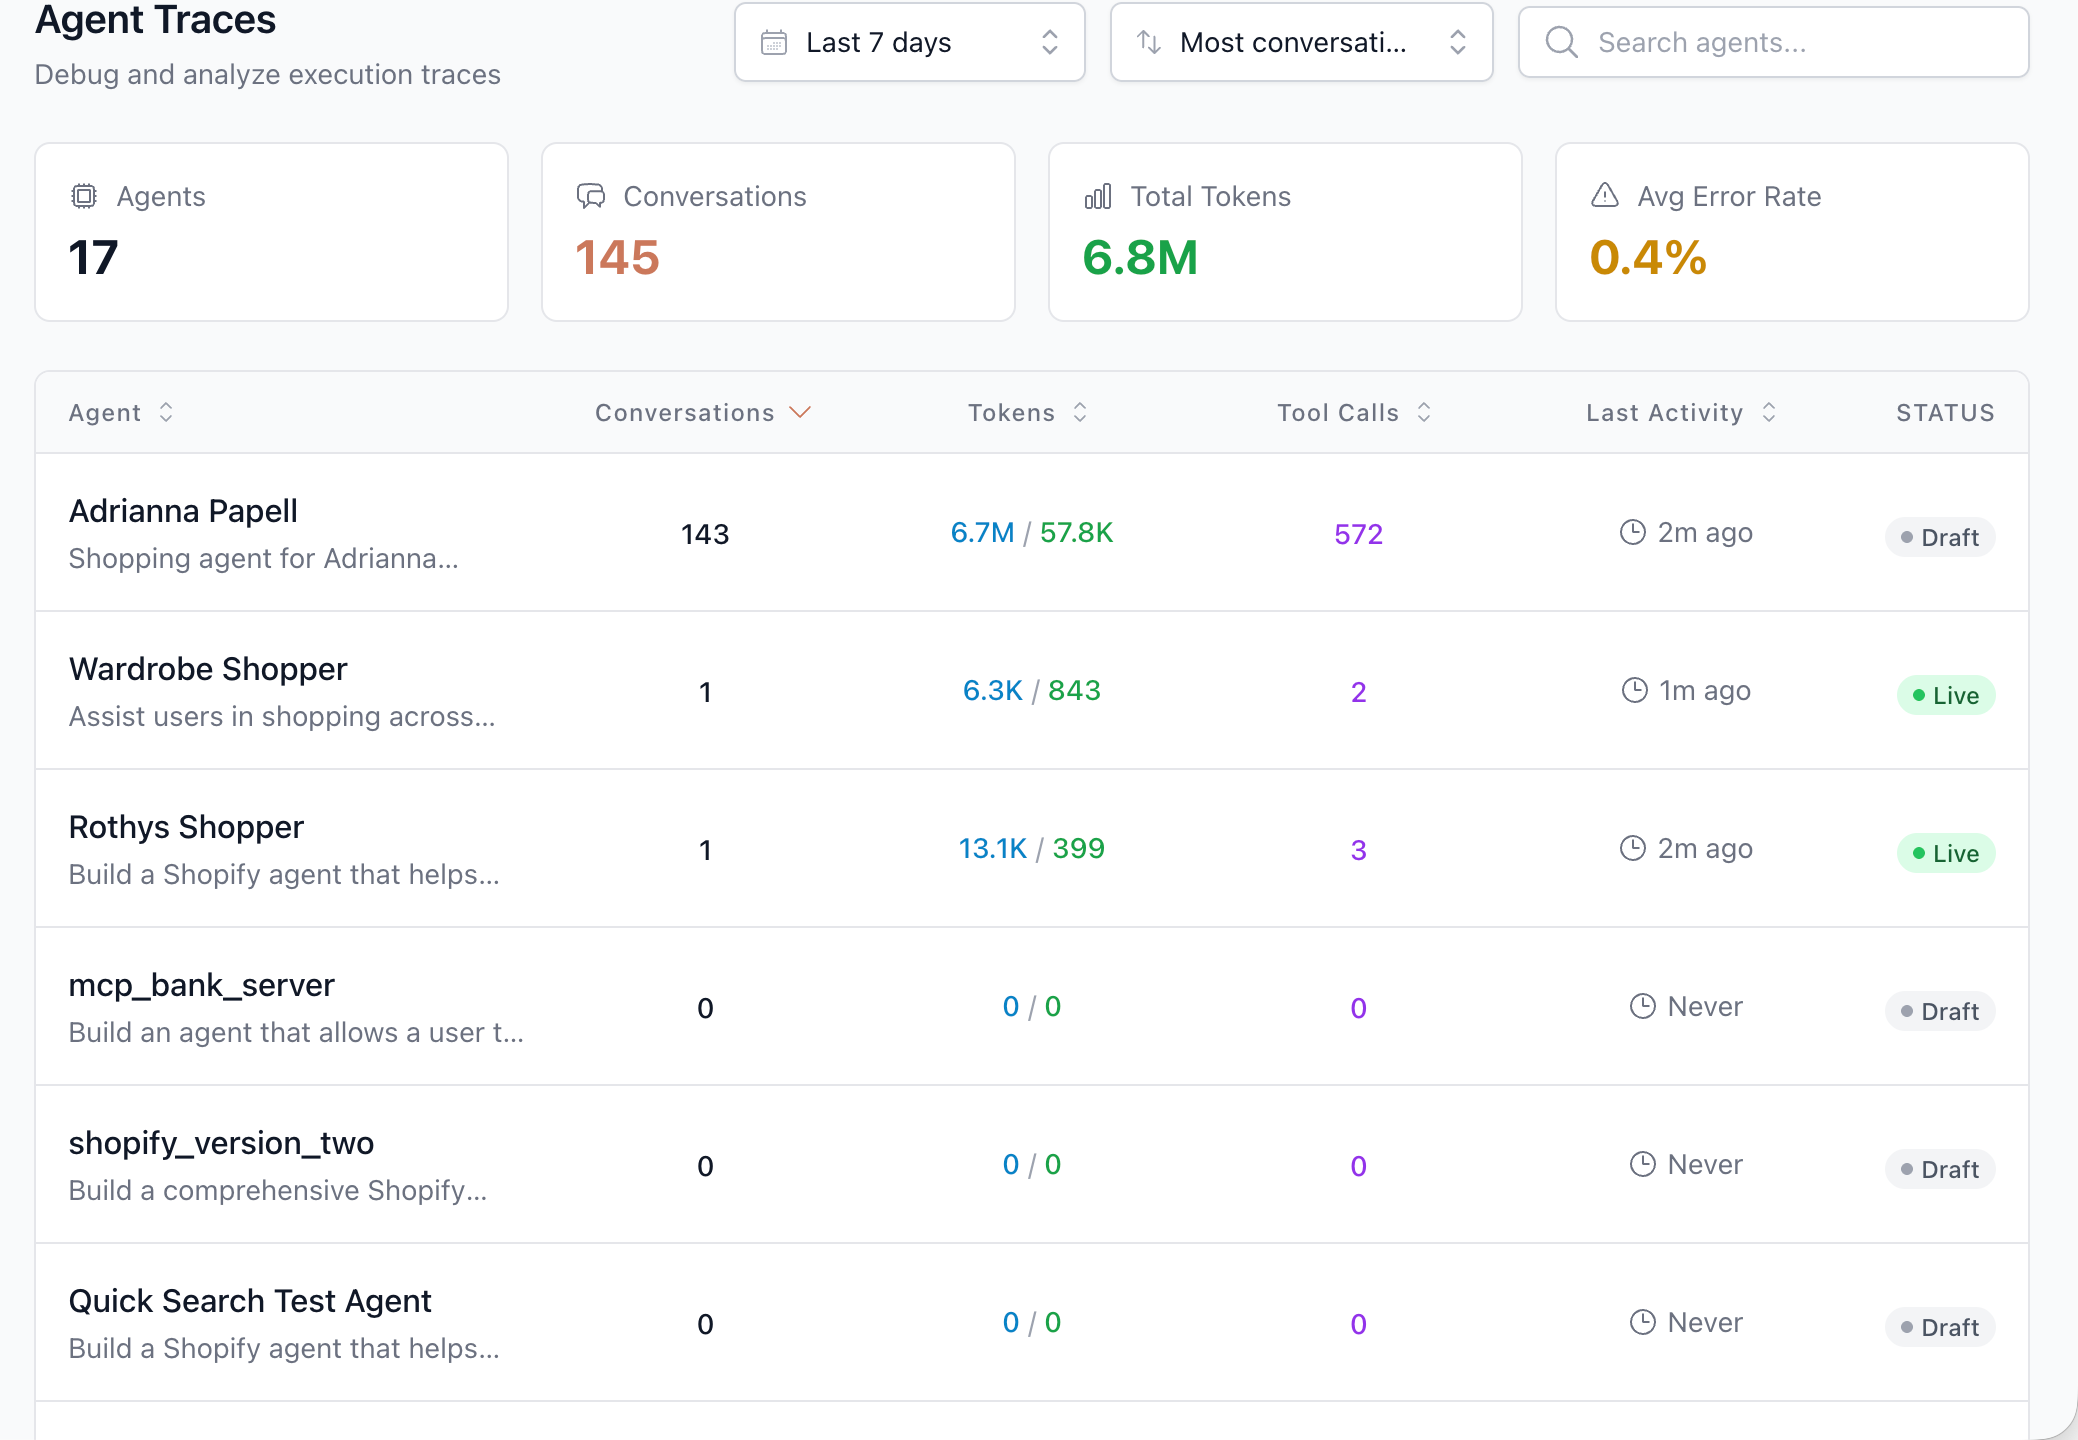
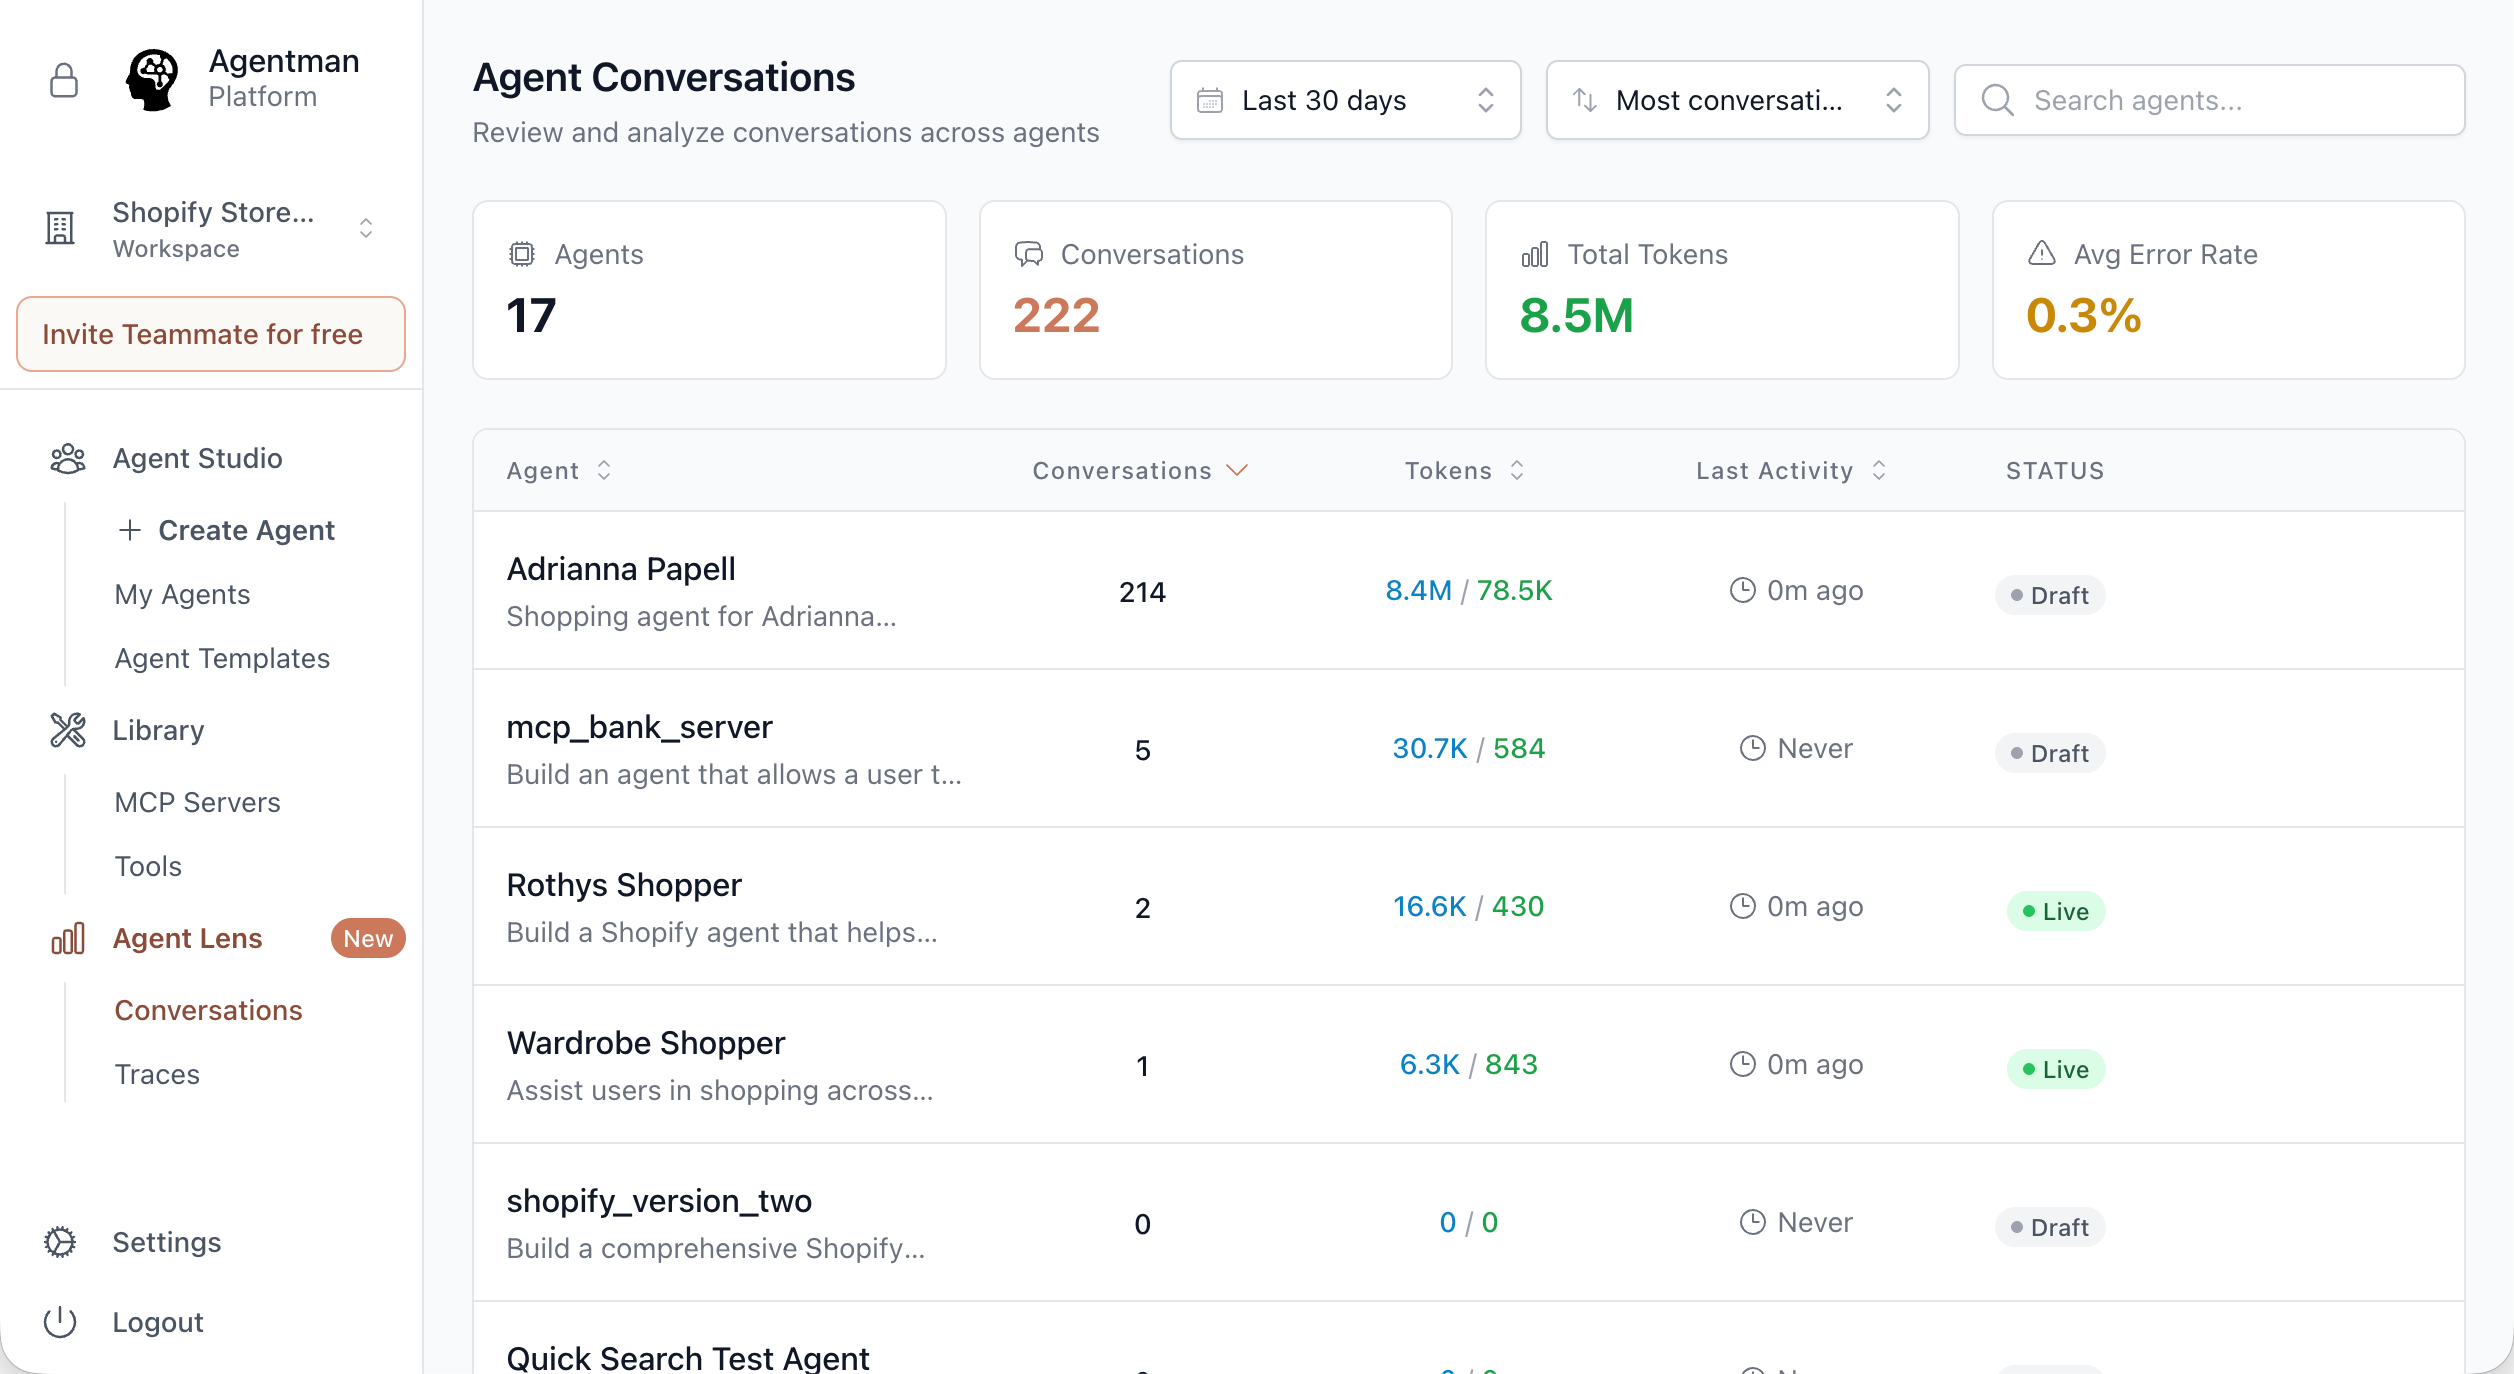
Fleet Overview
See all your agents in one dashboard. Conversations, tokens, activity, status—know what's happening across your entire operation at a glance.
- •17 agents, 222 conversations, 8.5M tokens visible in one view
- •Filter by date range (Last 7 days, 30 days, 90 days)
- •Sort by most conversations, latest activity
- •Search agents by name
Conversation Browser
Click any agent to see its conversations. Scan first inputs and last outputs to quickly understand what users needed and whether they got it.
- •Conversation ID for tracking
- •Turn count shows conversation complexity
- •First input / Last output preview
- •Token usage per conversation
- •Timestamps show recency
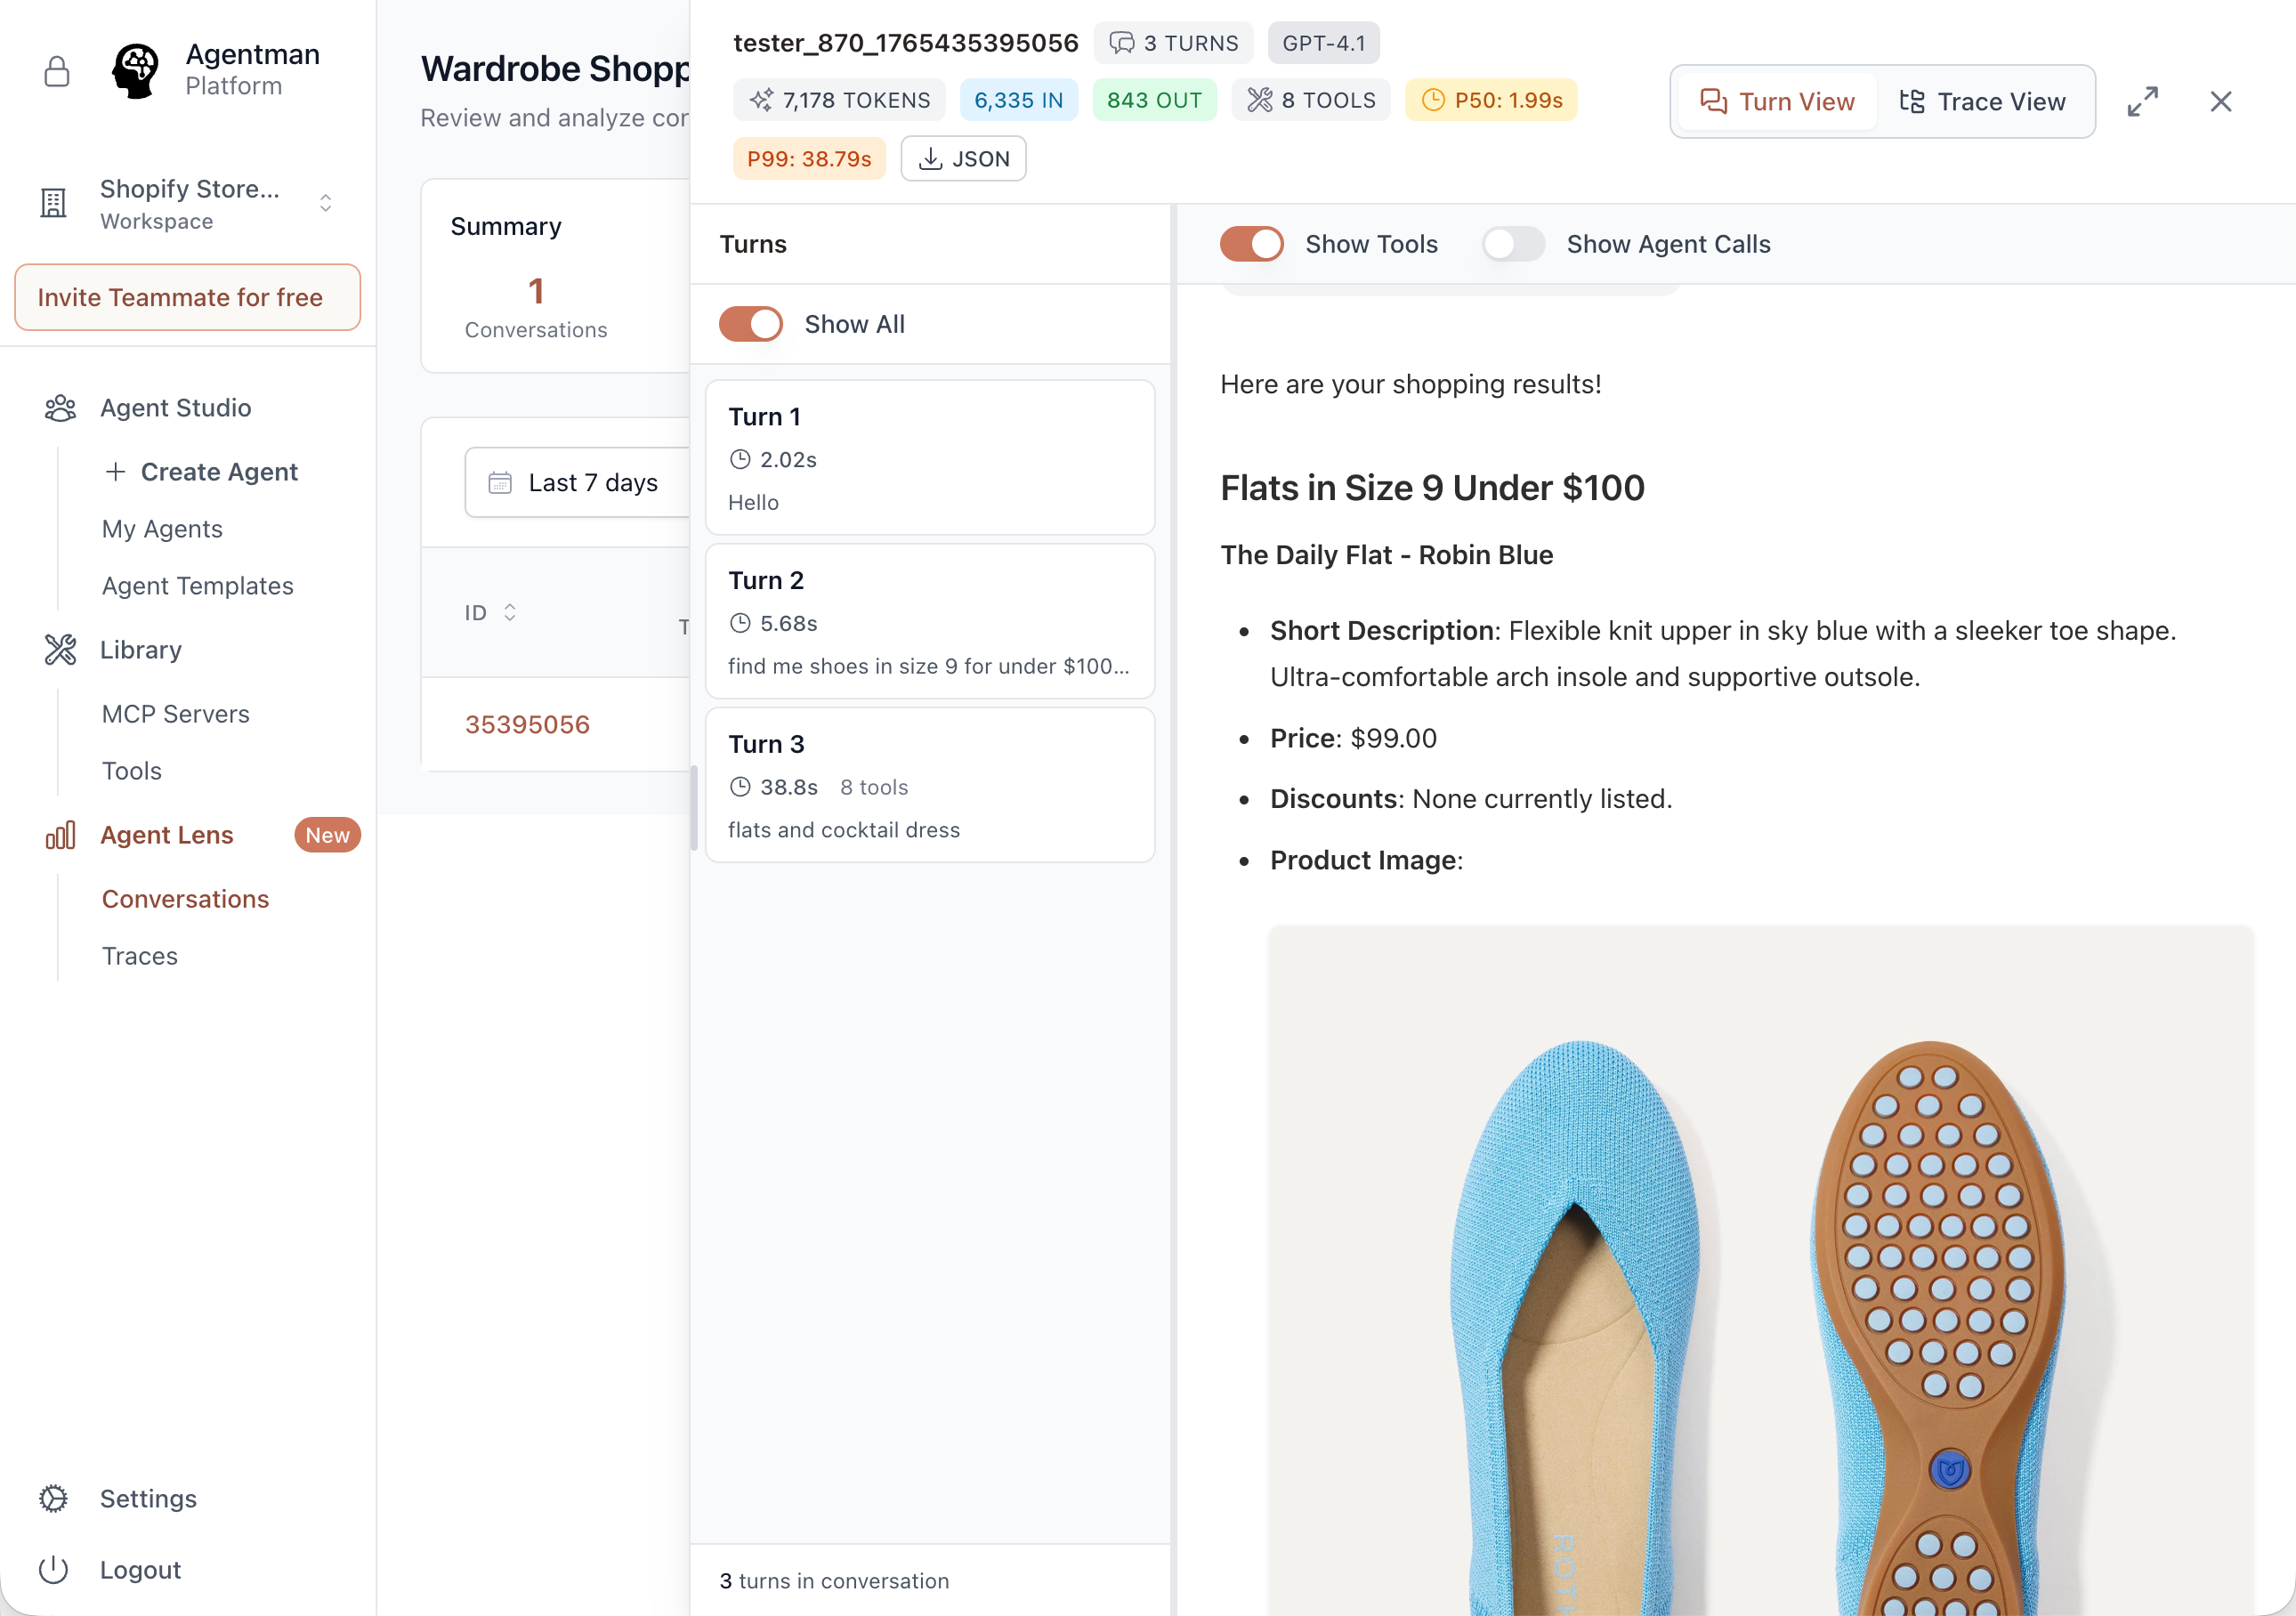
Conversation Detail
Open any conversation to see the full exchange. Every turn, every response, formatted for easy reading. Toggle to show tool calls and sub-agent invocations.
- •Clean turn-by-turn view with timing per turn
- •Show Tools toggle reveals what tools were called
- •Show Agent Calls toggle reveals sub-agent orchestration
- •Rich output display including images and formatted content
Performance at a Glance
Every conversation shows its cost and speed. Spot expensive conversations. Find slow responses. Understand your operational metrics.
- •Input tokens vs output tokens (6,335 IN / 843 OUT)
- •P50 and P99 latency (1.98s / 38.77s)
- •Tool call count per conversation
- •Error percentage (0.0% target)
Complete visibility into agent operations
From fleet-wide metrics to individual tool calls, AgentLens captures everything you need to understand and improve your agents.
Agents
Total agents in your workspace. Click to filter conversations and traces by specific agent.
Conversations
Total conversations across all agents. Drill down to see individual exchanges.
Total Tokens
Combined input and output tokens. Understand your LLM costs at scale.
Tool Calls
Total tool executions across all conversations. See which integrations are most used.
Avg Error Rate
Percentage of conversations with errors. Target: 0.0%. Alert when it rises.
Latency (P50/P99)
Response time percentiles. P50 is typical. P99 is worst case. Both matter.
See the full picture when agents orchestrate agents
Modern agents don't work alone. They call sub-agents, each with their own models and tools. AgentLens shows you the complete orchestration.
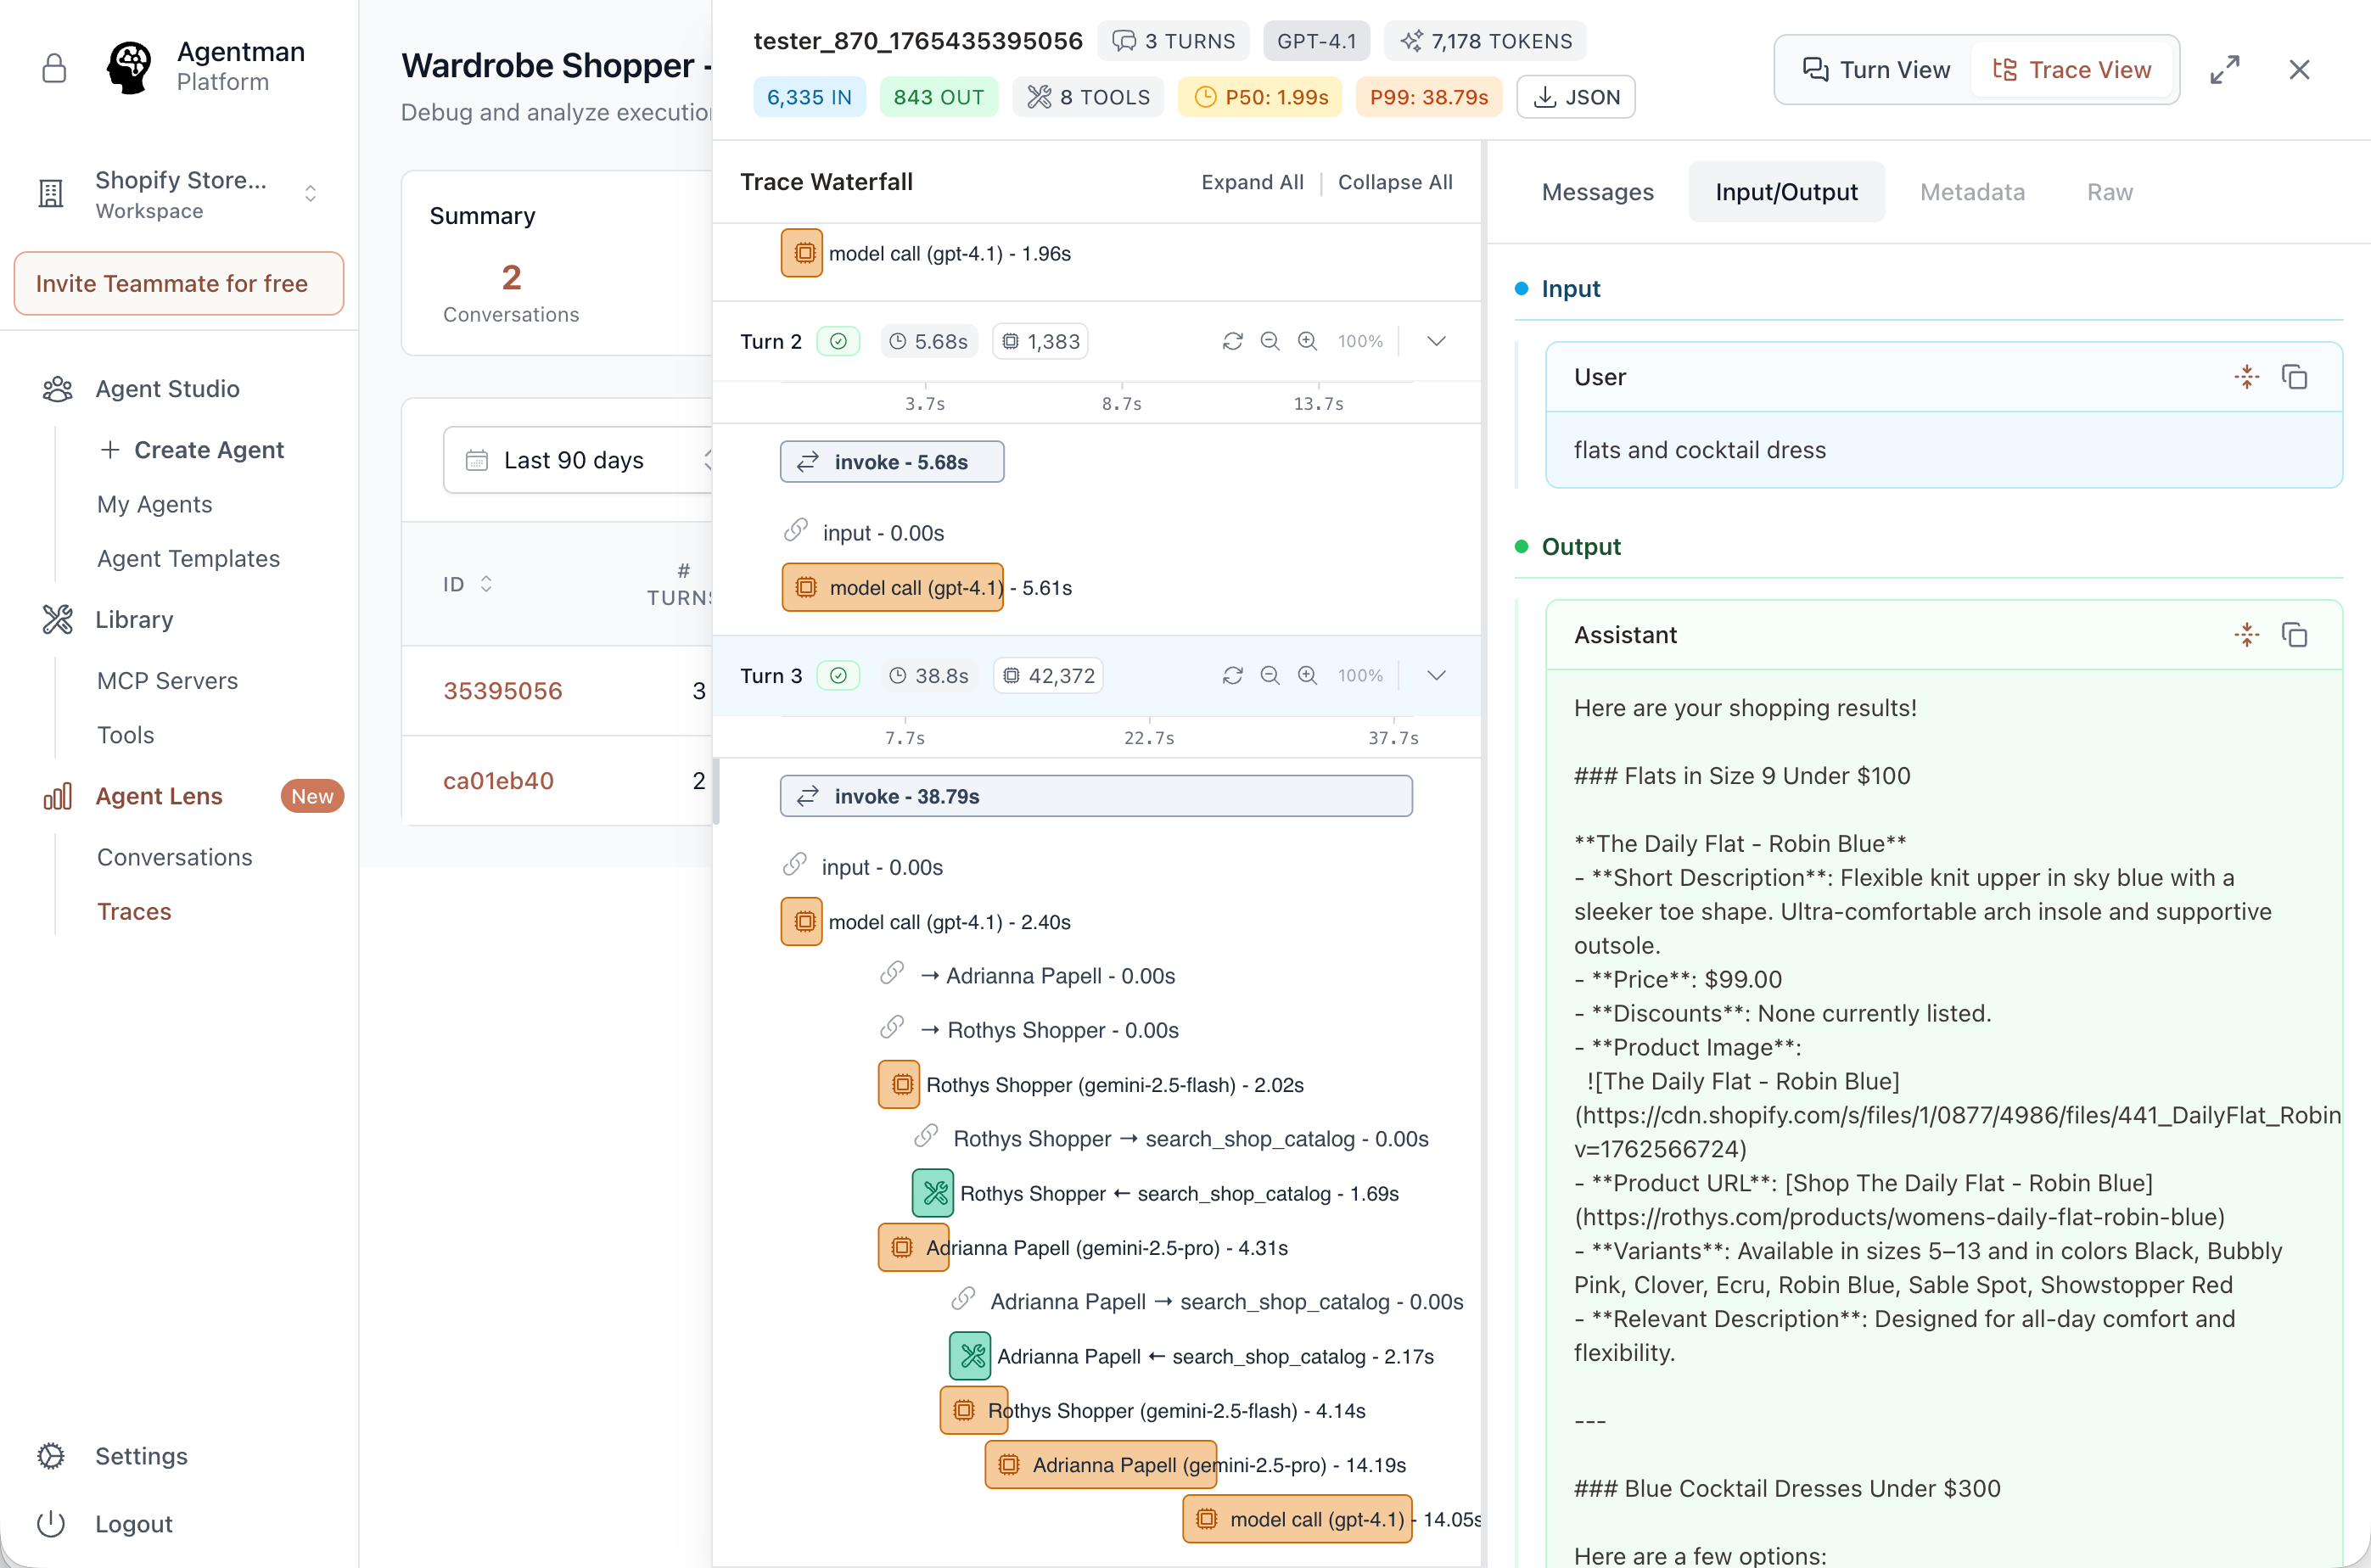
Trace Waterfall: See multi-agent orchestration with millisecond precision
The Scenario
Customer asks: "flats and cocktail dress." The Wardrobe Shopper searches multiple brand catalogs.
What AgentLens Shows
Insight: The final aggregation takes 14s—your optimization target. Without AgentLens, you'd never know.
See how production agents actually work
This is real output from a multi-store shopping agent helping a customer find products across brands.

Conversation detail: Browse real user interactions with rich output display
The Conversation
What the Agent Produced
Flats Under $100
The Daily Flat - Robin Blue
$99.00
+ Blue Cocktail Dresses from Adrianna Papell...
What AgentLens Reveals
Tool Calls
8
Total Tokens
7,178
Input/Output
6,335 / 843
P50 / P99
1.99s / 38.79s
Agent-first observability, not generic LLM tracing
We used LangSmith and Langfuse for nearly two years. They're good for developers debugging LLM calls. AgentLens is built for teams operating production agents.
The Difference
LangSmith answers:
"Which span had an error?"
AgentLens answers:
"Why didn't my customer find the shoes they wanted?"
Debug faster when everything works together
AgentLens integrates with the complete Agentman platform. Find an issue, fix it, test it, deploy it—all in one workflow.
Find a failing pattern
Fix the agent
Test the fix
Monitor in production
The Flywheel
See a problem in AgentLens → Fix in AgentStudio → Test in AgentForge → Deploy → Monitor in AgentWatch → Verify in AgentLens.The loop closes. That's continuous improvement.
Stop guessing. Start seeing.
Every conversation. Every trace. Every insight.
Know exactly how your agents perform in production.
Debug in minutes, not hours.
Common Questions
What agents can I observe with AgentLens?
Any agent built in Agentman Studio is automatically instrumented for AgentLens. For agents built elsewhere, we provide an SDK to send traces to AgentLens.
How much historical data is retained?
All plans include 30 days of conversation and trace history. Enterprise plans offer extended retention up to 1 year for compliance requirements.
Can non-technical team members use AgentLens?
Yes! The Conversations view is designed for business users who want to understand how customers interact with agents. No engineering background needed—just browse conversations like reading emails.
Is sensitive data protected?
AgentLens inherits Agentman's enterprise-grade security: HIPAA compliant, SOC2 ready, ISO 27001 ready. PII can be automatically redacted in views while preserving full data for authorized debugging.
How does AgentLens handle high volume?
AgentLens is built to scale. We process millions of traces daily across our customer base. Performance doesn't degrade as your conversation volume grows.
What's the latency overhead?
Minimal. AgentLens captures traces asynchronously and does not add latency to your agent's response time. Typical overhead is <5ms.